

What will it cost to have a festive dinn ...
Member news
What will it cost to have a festive dinner for Azerbaijani families this year
By Saadat Khanifayeva, PR Manager at Veyseloglu Group of Companies
Economists often make comparisons between sets of figures (data) across periods of time. When displaying such data shown over time, it often makes sense to use index numbers. In other words, index numbers are a simple way of making it easier to compare numbers over a period of time.
Veyseloglu Group of Companies has come up with an index of its own, known as ‘Veyseloglu Retail Index’ amongst the economists and the business community in Azerbaijan. This indicator shows the change in the overall price level of the most purchased goods in retail outlets (Araz and OBA supermarket chains) belonging to the Group over the past 24 months. The index, however, does not indicate a precise level of inflation. You can read the latest edition of VRI here.
What’s the point for ordinary consumers?
The indexes that represent the changes in consumer goods prices are, of course, interesting for ordinary people who can track the price changes and understand their own purchasing power. At the same time, there are plenty of various nominal indexes across the world that compare not just the prices, but other economic or monetary indicators. You may have heard of the Big Mac Index, for instance. Economic commentators in the former Soviet Union often refer to the ‘Borscht Set’ which tracks the prices for the vegetable ingredients required for this traditional Ukrainian soup (white cabbage, potatoes, beetroot, onions and carrots).
Recently, a Moscow-based economist Alexander Abramov found a rather unorthodox telltale predictor of inflation: gummy bears. He updates his figures through his Facebook posts which he calls the “Abramov Index”. In essence, this is his personal compilation of prices for the sticky marmalade candies (gummy bears) and 11 other regular family purchases that depict, according to him, a more realistic picture of inflation levels. Though unscientific and lacking in statistical rigor, Abramov’s numbers have attracted something of a following on Facebook, especially among experts seeking to figure out where price growth is headed.
Our ‘response’ to Abramov
We've been motivated by Alexander Abramov’s approach and thought of coming up with our own index, albeit very nominal, in the run-up to Novruz, one of Azerbaijan’s most iconic and favorite festivities. We have called our own figures ‘Shah Pilau Index’ and ‘Keta Index’. Why are they nominal? Well, for starters, there is no comparison of prices here and no period of time is involved. These are simply current prices for the main ingredients in question that you can see in our supermarkets right now.
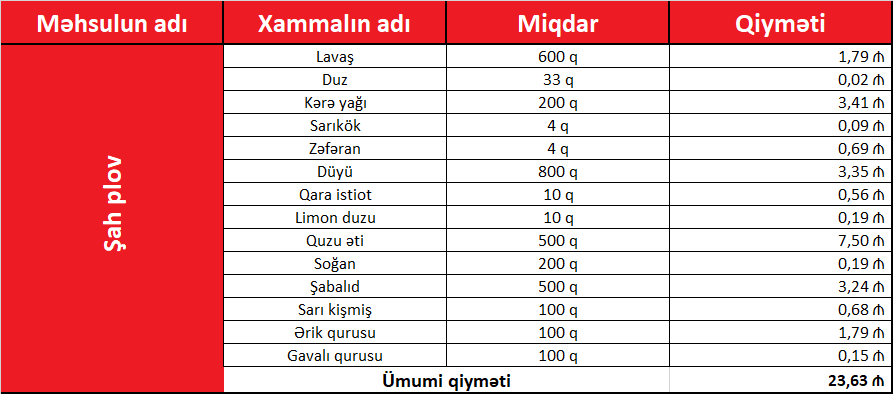
To put things in perspective, we asked our analyst Farid Nabizade to explain what it’s all about:” Almost every Azerbaijani family will most definitely have our traditional rice dish, plov, and some traditional sweets on their festive tables. We have made some adding-up and concluded that this festive rice dish will cost 23,63 manats, while the Karabakh keta will amount to 9,04 manats for a family of 4 or 5 people. These figures are drawn based on the current prices for the main ingredients required for both plov and keta in our supermarkets today’


Related News
Veysəloğlu Şirkətlər Qrupu iyul ayı üzrə Pərakəndə İndeksini açıqlayıb
Veysəloğlu Şirkətlər Qrupu aylıq təqdim edilən “Veysəloğlu Pərakəndə İndeksi” vasitəsilə məlumatları ictimaiyyətlə açıq paylaşmaqla müştərilərə istehlak səbətlərini planlayan zaman dəstək olmağı hədəfləyir.İndeks göstəricilərinə Veysəloğlu Şirkətlər Qrupunda istehlak məqsədi ilə məhsul alan bütün müştərilərin ən çox aldığı 4317 məhsul daxil edilib. Bu siyahıya qısa müddətli istifadəyə yararlı istehlak məhsulları (təzə qida), qida, spirtli və spirtsiz içkilər, həmçinin tütün məmulatları daxildir. İndeksin hesablanması zamanı satış miqdarlarına görə hər kateqoriyaya ağırlıq veririlir. Nəticədə müştərilərin orta illik və aylıq qiymət dəyişikliyi tempini izləmək mümkün olur.“Veysəloğlu Pərakəndə İndeksi”-nə daxil edilən məhsulların qiymətində 2021-ci ilin iyul ayında 2020-ci ilin iyul ayı ilə müqayisədə 4,8% artım müşahidə edilir. Belə ki, 2021-ci il iyul ayında 2020-ci ilin iyul ayı ilə müqayisədə təzə qida məhsullarında 1,2%, qida və spirtsiz içkilərdə 8,2%, alkoqol və tütün məmulatlarında isə 5,5% artım olub.Veysəloğlu Şirkətlər Qrupunun missiyası cəmiyyəti təmiz, sağlam, münasib qiymət və keyfiyyətə gündəlik istehlak malları ilə təmin etməkdir. Təqdim olunan pərakəndə satış indeksi göstəricilərinə əsasən aydın olur ki, Şirkətlər Qrupu bazarda münasib və maksimum sabit qiymət siyasəti aparmaqla öz missiyasına xidmət edir.
Veyseloglu Group of Companies announced the Retail Index for August
The Veyseloglu Retail Index includes the most purchased 4,317 products by customers of Veyseloglu Group of Companies. This index includes fresh food (FMCG), food and non-alcoholic beverages, alcohol and tobacco products. Each category is weighed according to sales volumes. As a result, it is possible to track change in average annual and monthly product prices.Compared to August 2020 in August 2021 the product prices included in the "Veyseloglu Retail Index" increased by 6.1%. Compared to August 2020 in august 2021 there was an increase by 4.0% in fresh food, 8.5% in food and non-alcoholic beverages and 5.6% in alcohol and tobacco products.The mission of Veyseloglu Group of Companies is to provide society with fresh, healthy, affordable and high quality daily consumer goods. Based on the presented Veyseloglu Retail Index, it is clear that the Group of Companies serves its mission by pursuing a reasonable and maximum stable pricing policy.
Veyseloglu Group of Companies announced the Retail Index for September
The Veyseloglu Retail Index includes the most purchased 4,317 products by customers of Veyseloglu Group of Companies. This index includes fresh food, food and non-alcoholic beverages, alcohol and tobacco products. Each category is weighed according to sales volumes. As a result, it is possible to track change in average annual and monthly product prices.Compared to Semptember 2020 in September 2021 the product prices included in the "Veyseloglu Retail Index" increased by 7,7%. Compared to September 2020 in September 2021 there was an increase by 6,7% in fresh food, 9,5% in food and non-alcoholic beverages and 5,8% in alcohol and tobacco products.